Introduction
GoluxAI is an advanced web application designed to estimate the electricity generation of grid-connected photovoltaic (PV) systems.
Using hourly solar resource data for various global locations, GoluxAI aids homeowners, small building owners, installers and manufacturers in developing preliminary production estimates for potential PV installations.
The platform offers three main modes: Drawing Mode, Electricity Price Inspector Mode and LuxAI Assistant. Each of them provides unique functionalities to enhance user experience and support sustainable energy decisions.
Frequently Asked Questions (FAQs)
General Questions
GoluxAI is a web application that estimates the electricity generation of a grid-connected photovoltaic (PV) system using hourly solar resource data for locations throughout the world. It allows homeowners, small building owners, installers and manufacturers to develop preliminary production estimates of potential PV installations.
GoluxAI is equipped with three main modes: Drawing Mode, Electricity Price Inspector Mode and LuxAI Assistent.
GoluxAI collaborated with partners to integrate renewable energy data and electricity prices to facilitate adequate results for transition to solar energy.
GoluxAI's mission is to empower a sustainable future through innovation. Our goals are:
- to accelerate the adoption of solar energy by providing accessible tools and resources,
- to equip users with insightful data on the European electricity markets and solar energy generation,
- to inspire informed decisions on solar investments and energy consumption.
The author of GoluxAI is Nikola Golubovic. Nikola is a software engineer from Serbia and a passionate advocate for renewable energy.
For more information visit About usYou can contact GoluxAI by sending an email to contact@goluxai.com
Golux collect no personally identifiable information about you when you visit GoluxAI.com .
If you allow us, your location is aquired via IP address, but we do not store this information.
While GoluxAI does not collect your information, the third-party services we use may collect information about you, such as:
- Google Analytics - collects information about your use of the website, such as how often users visit the site, what pages they visit when they do so and what other sites they used prior to coming to this site. We use the information we get from Google Analytics to improve our site. Google Analytics collects only the IP address assigned to you on the date you visit this site, rather than your name or other identifying information. We do not combine the information collected through the use of Google Analytics with personally identifiable information. Although Google Analytics plants a permanent cookie on your web browser to identify you as a unique user the next time you visit this site, the cookie cannot be used by anyone but Google. Google’s ability to use and share information collected by Google Analytics about your visits to this site is restricted by the Google Analytics Terms of Use and the Google Privacy Policy.
As a free tool, we don't ask for monetary donations. Instead, you can support GoluxAI in the following ways:
- Tell your friends and family about GoluxAI! The more people use our tool, the better we can make it.
- Help us improve! Your feedback is invaluable in helping us enhance GoluxAI. Send us email to contact@goluxai.com
By using GoluxAI, you can benefit by optimizing the energy expenses, minimize carbon emissions and foster sustainability.
However, please note that while our software aids in preliminary assessments, it may not encompass all factors crucial for photovoltaic system design. For comprehensive solutions tailored to your needs, collaborate with qualified professionals who leverage detailed engineering and financial analysis tools to finalize your system design based on precise location assessments.
GoluxAI uses followig data sources for the algorithms:
1. Solar Resource DataSolar resource data is solar irradiance and meteorological data that describe the conditions at the system's location. GoluxAI uses a set of weather data prepared from the NREL National Solar Radiation Database (NSRDB) where it is available and a collection of data from other sources for the rest of the world.
2. Electricity prices for day aheadData is organized by every market time unit the day-ahead prices in each bidding zone (Currency/MWh). GoluxAI uses a set of electricity data prepared from the European Network of Transmission System Operators for Electricity
3. MapMap data is provided by OpenStreetMap and Mapbox
Drawing Mode
Drawing Mode is a feature of the GoluxAI web application. It allows users to draw solar panels polygons on satellite images to calculate solar potential for specific areas.
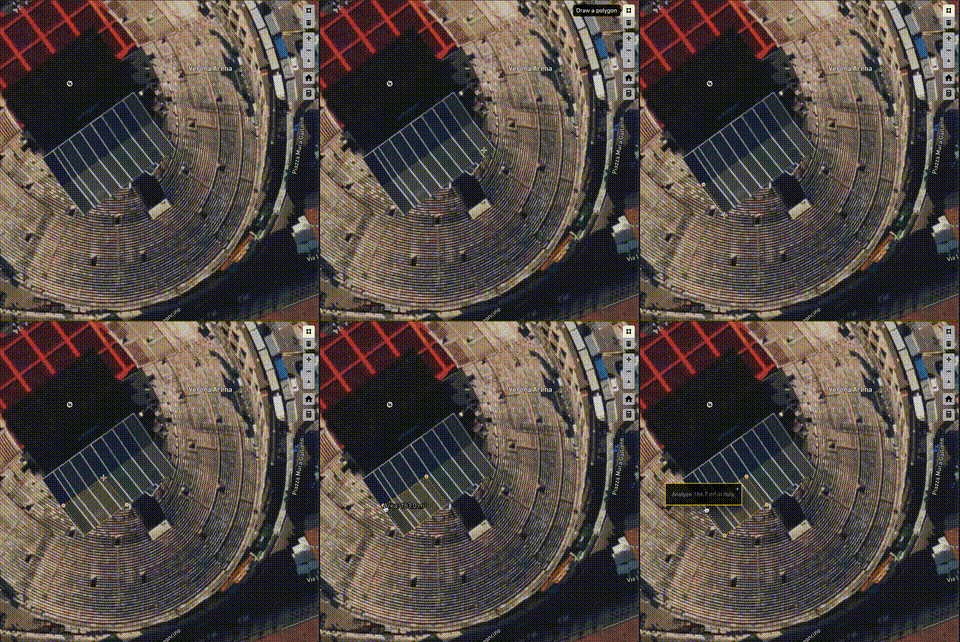
To draw one or more polygons on the satellite image, switch to Drawing Mode using the toggle button.

Once in Drawing Mode, enable drawing by clicking on the button located in the upper-right corner.
Draw your polygons on the map. If needed, you can focus on a specific location by using the search bar to enter an address, or by using the zoom-in and zoom-out buttons.
After drawing the polygons, execute the analysis by clicking the popup button that appears on top of the recently drawn polygon or by clicking the button.
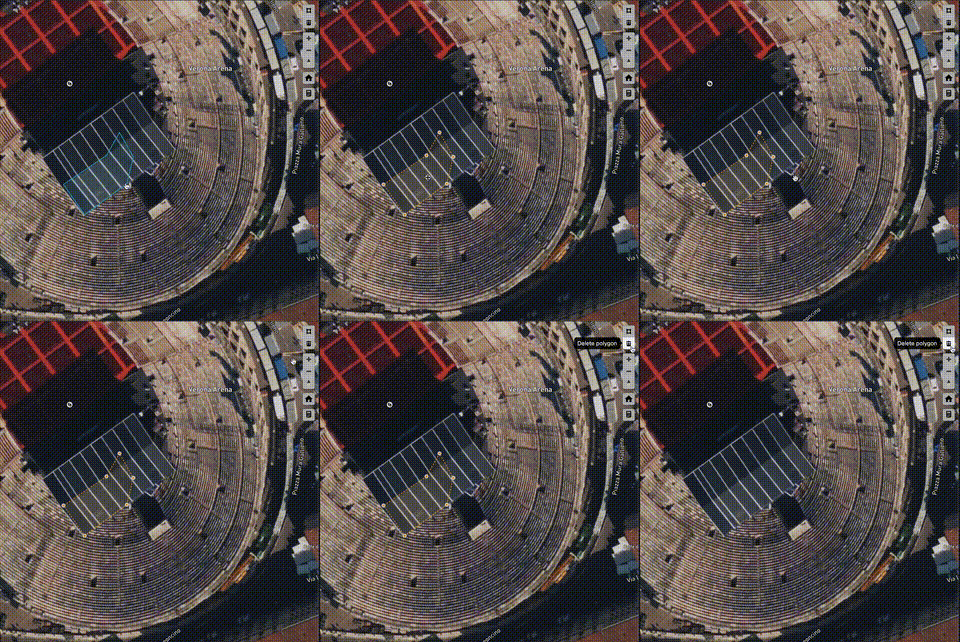
Video representation of the drawing mode

The easiest way of finding your location is by clicking the icon .
You can search for a specific location by providing a name of the place in search bar in upper-left corner. This input field allows you to find any location in the world provided by OpenStreetMap.
Deletion is done by selecting the polygon(s) and clicking the button . This will delete all polygons drawn on the map.

Financial analysis calculations use default values for three parameters:
- Monthly bill
- Electricity price per kWh
- Solar PV system parameters
The default monthly bill amount is 80 euros. You can modify the solar PV system and electricity price parameters.
Click the icon to open a modal window for inputting solar parameters. The system requires six inputs to represent its physical characteristics:
- System Capacity: The DC power rating of the photovoltaic array in kilowatts (kW) at standard test conditions (STC).
- Module Type: Describes the photovoltaic modules in the array. Use the default Standard module type if you don't have specific module information.
- System Losses: Accounts for performance losses in a real system not explicitly calculated by the PVWatts® model equations. The default value is 14%.
- Array Type: Describes whether the PV modules in the array are fixed or move to track the sun's movement. The default value is for a fixed array.
- Array Tilt angle: The angle from horizontal of the photovoltaic modules in the array. The default value depends on the array type.
- Array Azimuth angle: The angle clockwise from true north describing the direction that the array faces. The default value depends on the hemisphere.
- Electricity Price per kWh: The default value depends on the selected country. For countries outside Europe, the default value is 0.18 euro.
After modifying the parameters, click the Update button to recalculate the financial
analysis.
The financial analysis is calculated based on the solar potential of the selected area(s), the user's monthly bill, PV solar paramaters and the electricity price in the user's country.
The analysis provides insights into the payback period, savings and ROI.
You can download the solar potential data chart by clicking on the download button below the chart.
You also have the option to download the data as a CSV file by clicking on the download button . If you just want to copy the data, you can do so by clicking on the copy button .Electricity Price Inspector Mode
The Electricity Price Inspector mode is a feature of the GoluxAI web application. It enables users to inspect electricity prices in euros per kWh across various European countries. By utilizing real-time data, it identifies optimal times for electricity usage, helping users reduce their energy bills.
In the Electricity Price Inspector mode, the map of Europe is color-coded to represent the day's electricity prices across different countries. Each color corresponds to a specific price range, with white indicating lower prices and red representing higher prices.
You can access historical electricity price data for any European country by selecting the corresponding polygon on the map and clicking the popup button.
Once the data is retrieved, a chart is displayed. You can filter this historical data by selecting predefined date ranges, such as 1 day, 5 days, 2 weeks, 1 month, 6 months, or 1 year.
You can download the electricity price data chart by clicking on the download button below the chart.
You also have the option to download the data as a CSV file by clicking on the download button . If you just want to copy the data, you can do so by clicking on the copy button .While price levels in 2023 still remain high in comparison to the years before 2021, the number of negative prices has exceeded previous years by far in most European countries. Especially in Scandinavia the number of negative prices rose sharply. The average number of Finland, Norway and Sweden thereby augmented twentyfold. This can most likely be attributed to the high feed-in from hydro power already present in the previous years which – paired with the high wind and solar generation of the year 2024 – led to a drop in prices below 0 €/MWh. Also in mid-Europe (Netherland, Germany, Denmark, Belgium and France) the number of hours with prices below 0€/MWh increased significantly. For Germany the increase in negative prices is analyzed in more detail in our price analysis for the German market. An exception builds Northern Ireland, where negative prices were much more present in 2020, than they were in 2023. 2020 thereby already marked a year with a high number of negative prices, coming close to the 2023 levels in Germany, Austria and Slovakia. Yet, except for Northern Irland and Slovakia the number of negative prices in 2023 exceed the amount of 2020 for all other European countries. This negative prices as well as the high price spreads thereby set high incentives for the integration of flexible assets, despite the drop in absolute price levels.
Source ffe.de
LuxAI Assistent
LuxAI is the friendly AI assistant you'll encounter while using GoluxAI.
LuxAI is here to help you with any questions you may have about electricity prices in Europe - such as asking for a price on a particular date (range) or looking for trends in your favor.
Think of LuxAI as your personal guide through the world of solar power on GoluxAI.
LuxAI Assistent uses open-source AI libraries and data for electricity prices in Day Ahead
segment of
ENTSOE-E.
- relying on conversation's history to provide answers to new questions,
- interacting with a SQL database,
- converting the query results to human's readable text.